Dose
OpenShieldHIT SHIELD-HIT12A OpenTOPAS
Open interactive plot ↗
Plan browser
1D profiles along the beam (Z) axis, narrow lateral acceptance. One plot per quantity × medium × particle filter. All available codes overlaid.
Differential LET and kinetic-energy spectra in the target volume. Log-log scale with stair-step bins.
Single integrated values in the target detector volume (5×5×2 mm³). Shown as a grouped bar chart per code.
2D dose maps in the longitudinal plane. Preview images only.
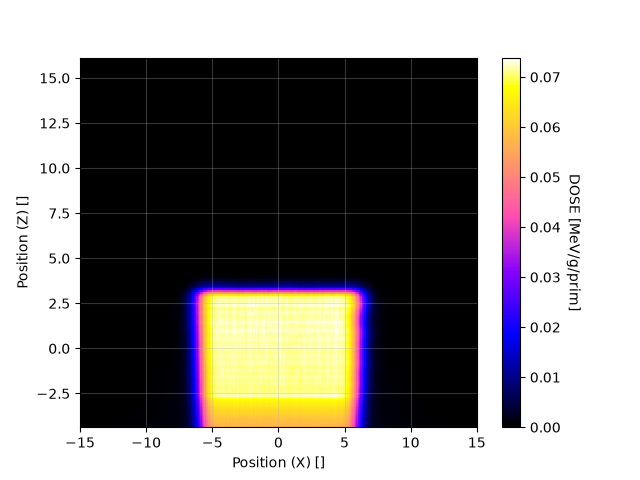
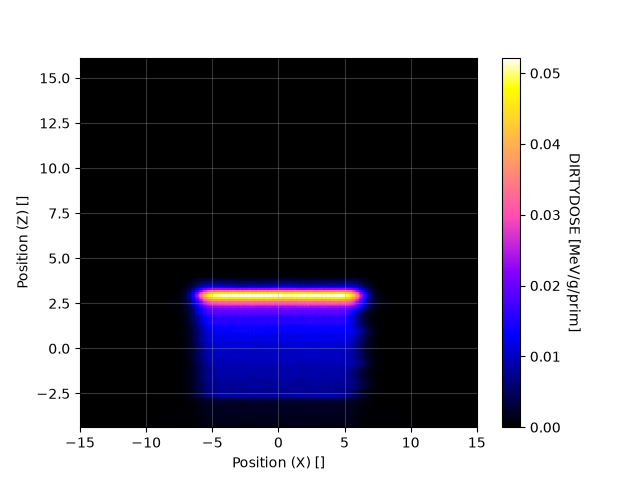
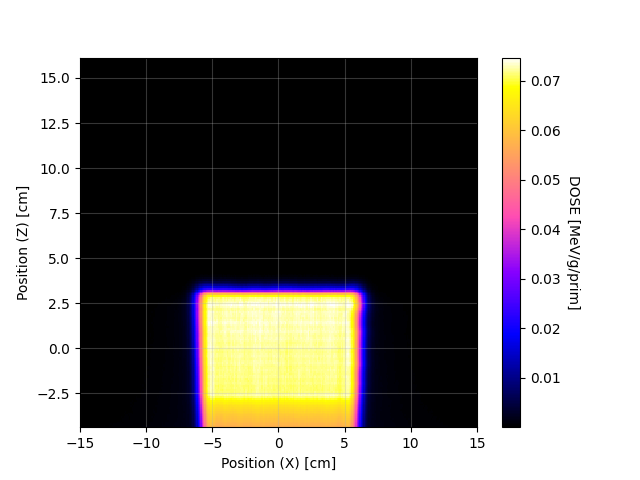
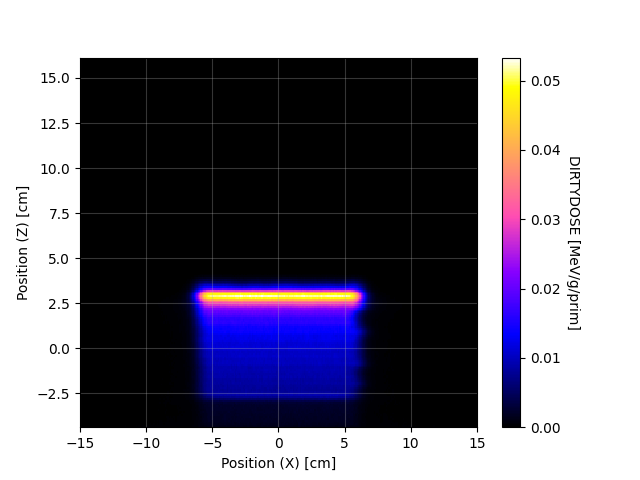
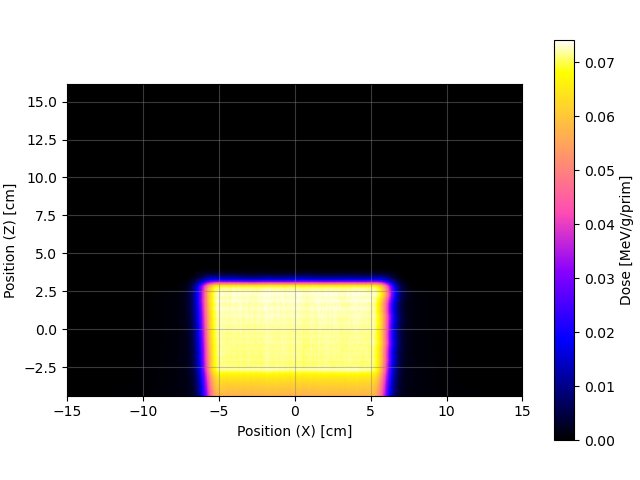
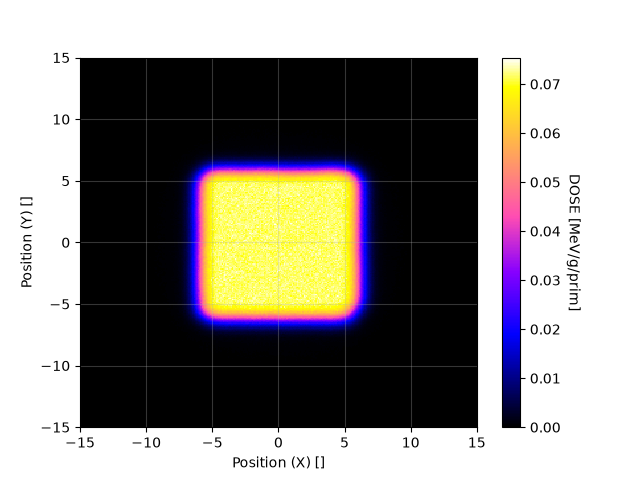
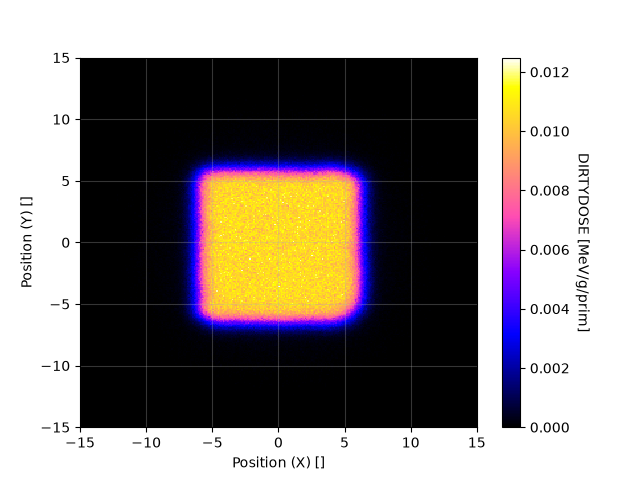
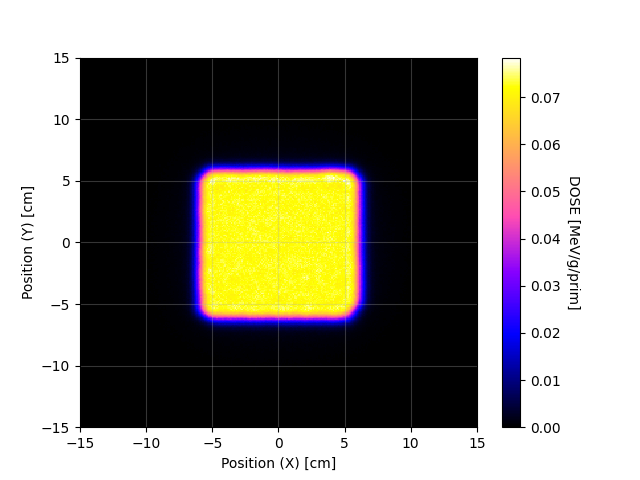
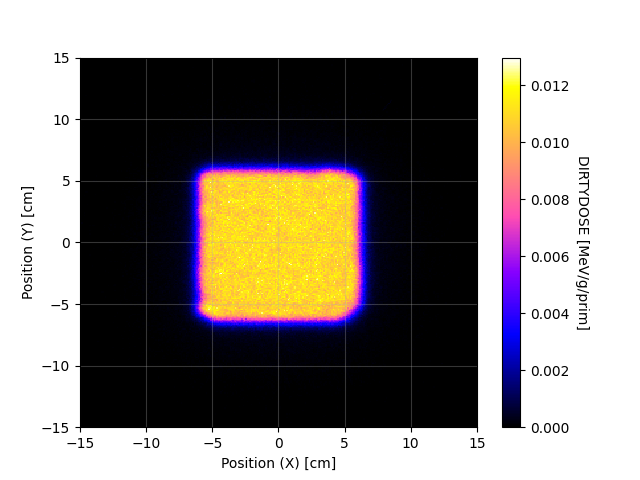
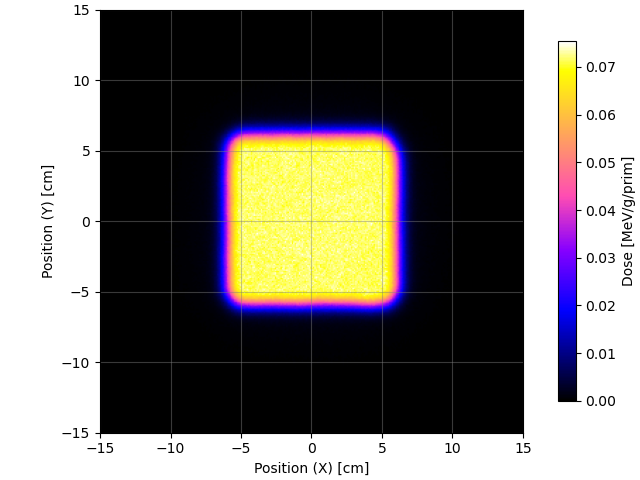
2D dose maps in the transverse plane. Preview images only.